
For the people who run the platform
Every service and what it depends on, in one live map, from the OpenTelemetry you already send.
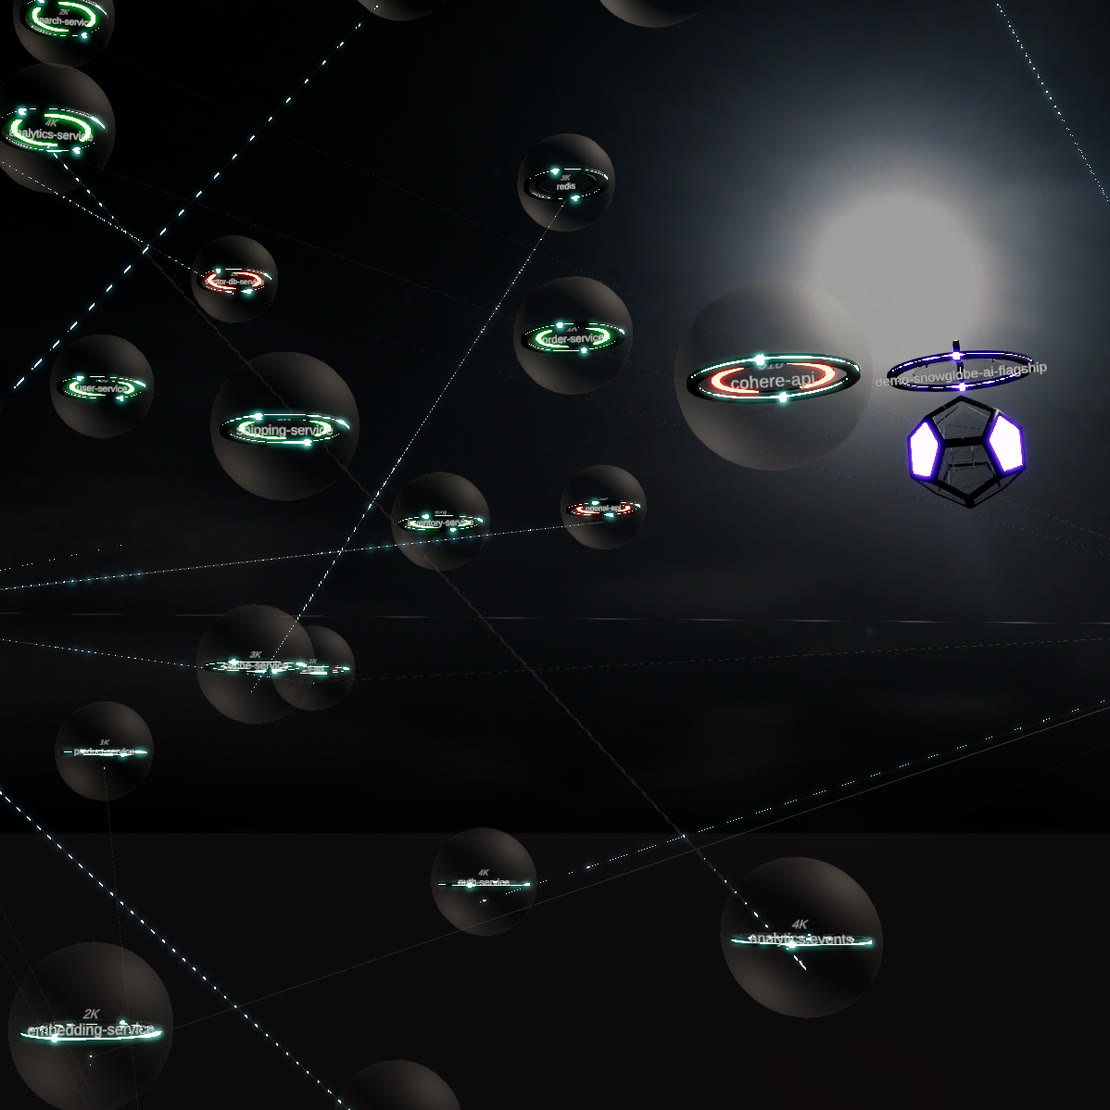

See exactly where the cloud budget goes
- 360° stack visibility
- Real-time 3D data visualization
- Immersive root cause analysis
- AI Assistant guidance
What You Can See and Manage
- Live topology, not static inventory
- Change impact in view
- Waste is visible
- Standards-native: OpenTelemetry in, no proprietary agents, your data stays portable
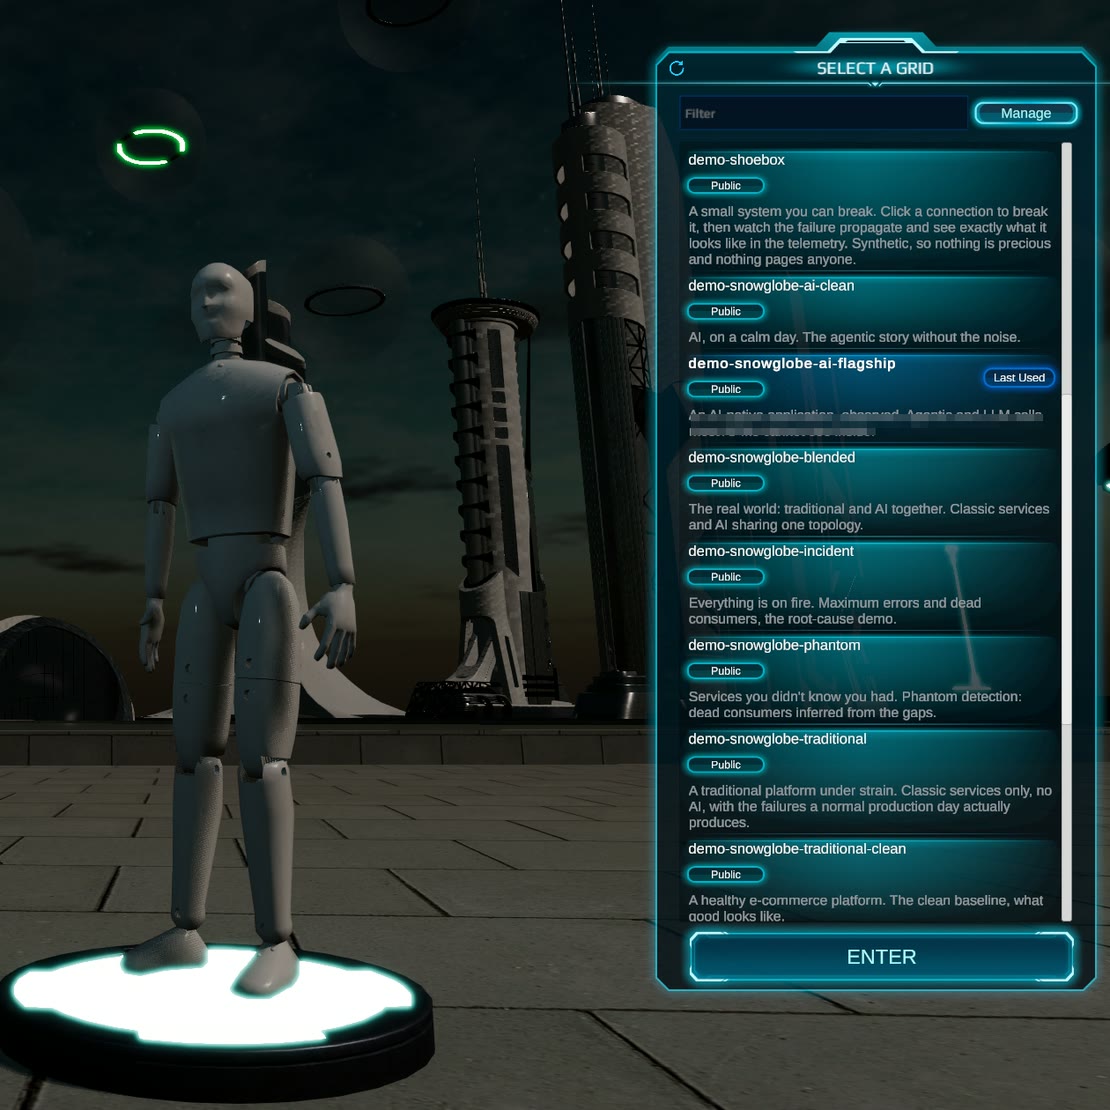
Traditional APM vs DeepCube
| Traditional APM | DeepCube |
|---|---|
| Multiple dashboards to correlate | Single immersive environment |
| Static graphs and charts | Interactive 3D system exploration |
| Manual root cause analysis | AI-guided problem resolution |
| Tool replacement required | Works with existing investments |